ELK使用及elastalert告警设置(1)
1.系统部署
 **1):部署过程略...**

		#readme
		```bash
		1.问题:ERROR: bootstrap checks failed

		max file descriptors [4096] for elasticsearch process likely too low, increase to at least [65536]
		max number of threads [1024] for user [lishang] likely too low, increase to at least [2048]

		解决:切换到root用户,编辑limits.conf 添加类似如下内容

		vi /etc/色curity/闪电mits.conf

		添加如下内容:

		* soft nofile 65536

		* hard nofile 131072

		* soft nproc 2048

		* hard nproc 4096


		2.问题:max virtual memory areas vm.max_map_count [65530] likely too low, increase to at least [262144]

		解决:切换到root用户修改配置sysctl.conf

		vi /etc/sysctl.conf

		添加下面配置:

		vm.max_map_count=655360

		并执行命令:

		sysctl -p


		3.问题 elasticsearch,kibana,logstash,elastalert的运行用户
			ES/Kibana为elsearch
			logstash/elastalert为root

		```

  **2):需要软件**

   jdk1.8+  elasticsearch-6.4.1  logstash6.4.1   kibana-6.4.1     elastalert

3):配置文件
#es elasticsearch.yml/jvm.options
#elasticsearch.yml
	# ======================== Elasticsearch Configuration =========================
#
# NOTE: Elasticsearch comes with reasonable defaults for most settings.
#       Before you set out to tweak and tune the configuration, make sure you
#       understand what are you trying to accomplish and the consequences.
#
# The primary way of configuring a node is via this file. This template lists
# the most important settings you may want to configure for a production cluster.
#
# Please consult the documentation for further information on configuration options:
# https://www.elastic.co/guide/en/elasticsearch/reference/index.html
#
# ---------------------------------- Cluster -----------------------------------
#
# Use a descriptive name for your cluster:
#
#cluster.name: my-application
#
# ------------------------------------ Node ------------------------------------
#
# Use a descriptive name for the node:
#
#node.name: node-1
#
# Add custom attributes to the node:
#
#node.attr.rack: r1
#
# ----------------------------------- Paths ------------------------------------
#
# Path to directory where to store the data (separate multiple locations by comma):
#
#path.data: /path/to/data
#
# Path to log files:
#
#path.logs: /path/to/logs
#
# ----------------------------------- Memory -----------------------------------
#
# Lock the memory on startup:
#
bootstrap.memory_lock: false
#
# Make sure that the heap size is set to about half the memory available
# on the system and that the owner of the process is allowed to use this
# limit.
#
# Elasticsearch performs poorly when the system is swapping the memory.
#
# ---------------------------------- Network -----------------------------------
#
# Set the bind address to a specific IP (IPv4 or IPv6):
#
network.host: 192.168.1.0
#
# Set a custom port for HTTP:
#
http.port: 9200
#
# For more information, consult the network module documentation.
#
# --------------------------------- Discovery ----------------------------------
#
# Pass an initial list of hosts to perform discovery when new node is started:
# The default list of hosts is ["127.0.0.1", "[::1]"]
#
#discovery.zen.ping.unicast.hosts: ["host1", "host2"]
#
# Prevent the "split brain" by configuring the majority of nodes (total number of master-eligible nodes / 2 + 1):
#
#discovery.zen.minimum_master_nodes:
#
# For more information, consult the zen discovery module documentation.
#
# ---------------------------------- Gateway -----------------------------------
#
# Block initial recovery after a full cluster restart until N nodes are started:
#
#gateway.recover_after_nodes: 3
#
# For more information, consult the gateway module documentation.
#
# ---------------------------------- Various -----------------------------------
#
# Require explicit names when deleting indices:
#
#action.destructive_requires_name: true
#jvm.options
## JVM configuration

# Xms represents the initial size of total heap space
# Xmx represents the maximum size of total heap space

-Xms1g
-Xmx1g

################################################################
## Expert settings
################################################################
##
## All settings below this section are considered
## expert settings. Don't tamper with them unless
## you understand what you are doing
##
################################################################

## GC configuration
-XX:+UseParNewGC
-XX:+UseConcMarkSweepGC
-XX:CMSInitiatingOccupancyFraction=75
-XX:+UseCMSInitiatingOccupancyOnly

## Locale
# Set the locale language
#-Duser.language=en

# Set the locale country
#-Duser.country=US

# Set the locale variant, if any
#-Duser.variant=

## basic

# set the I/O temp directory
#-Djava.io.tmpdir=$HOME

# set to headless, just in case
-Djava.awt.headless=true

# ensure UTF-8 encoding by default (e.g. filenames)
-Dfile.encoding=UTF-8

# use our provided JNA always versus the system one
#-Djna.nosys=true

# Turn on JRuby invokedynamic
-Djruby.compile.invokedynamic=true
# Force Compilation
-Djruby.jit.threshold=0

## heap dumps

# generate a heap dump when an allocation from the Java heap fails
# heap dumps are created in the working directory of the JVM
-XX:+HeapDumpOnOutOfMemoryError

# specify an alternative path for heap dumps
# ensure the directory exists and has sufficient space
#-XX:HeapDumpPath=${LOGSTASH_HOME}/heapdump.hprof

## GC logging
#-XX:+PrintGCDetails
#-XX:+PrintGCTimeStamps
#-XX:+PrintGCDateStamps
#-XX:+PrintClassHistogram
#-XX:+PrintTenuringDistribution
#-XX:+PrintGCApplicationStoppedTime

# log GC status to a file with time stamps
# ensure the directory exists
#-Xloggc:${LS_GC_LOG_FILE}

# Entropy source for randomness
-Djava.security.egd=file:/dev/urandom
#logstash logstash.conf/jvm.options 这个重点!!!
正则表达式测试: https://github.com/logstash-plugins/logstash-patterns-core/tree/master/patterns
#logstash agent config
input {
        file {
            path => "/var/log/messages"
            type => "message"
            start_position => "beginning"
            }


    }


output {
        if [type] == "message" {

             elasticsearch {
                    hosts => ["192.168.1.0:9200"]
                    index => "message-%{+YYYY.MM.dd}"
                }
            }

    }


--------------------------------------------------------------------------------------------------以下是生产环境使用案例
input {
        file {
            path => "/jar/wechatseller/nohup.out"
            type => "wechatseller"
            start_position => "beginning"
            }
	file {
		path => "/jar/wechatseller-gf/nohup.out"
		type => "chinawind"
		start_position => "beginning"
            }
	file {
		path => "/jar/create-webmanager/nohup.out"
		type => "webmanager-create"
		start_position => "beginning"
	}


    }
filter {
		#过滤不需要的信息,INFO DEBUG WARN 等信息

       grok {
            match => [ "message", "%{SKYWALKING:skywalking}" ]
            match => [ "message", "%{WJJ_SPECIAL:wjj}" ]
            match => [ "message", "%{LOGLEVEL:Level}" ]
            }
        if [skywalking] == "192.168.1.191:11800" {
                drop {}
                }
        if ([Level] == "INFO" and [wjj] != "WJJLogAspect") {
                drop {}
                }
        if [Level] == "DEBUG" {
                drop {}
                }
        if [Level] == "WARN" {
                drop {}
                }
}
    output {
        if [type] == "wechatseller" {

             elasticsearch {
                    hosts => ["192.168.1.155:9200"]
                    index => "wechatseller_1-%{+YYYY.MM.dd}"
                }
            }
	if [type] == "chinawind" {
		elasticsearch {
			hosts => ["192.168.1.155:9200"]
			index => "chinawind-gf_1-%{+YYYY.MM.dd}"
		}
          }
	if [type] == "webmanager-create" {
	elasticsearch {
		hosts => ["192.168.1.155:9200"]
		index => "webmanager-create_1-%{+YYYY.MM.dd}"
		}
	}
}
#jvm

## JVM configuration

# Xms represents the initial size of total heap space
# Xmx represents the maximum size of total heap space

-Xms1g
-Xmx1g

################################################################
## Expert settings
################################################################
##
## All settings below this section are considered
## expert settings. Don't tamper with them unless
## you understand what you are doing
##
################################################################

## GC configuration
-XX:+UseParNewGC
-XX:+UseConcMarkSweepGC
-XX:CMSInitiatingOccupancyFraction=75
-XX:+UseCMSInitiatingOccupancyOnly

## Locale
# Set the locale language
#-Duser.language=en

# Set the locale country
#-Duser.country=US

# Set the locale variant, if any
#-Duser.variant=

## basic

# set the I/O temp directory
#-Djava.io.tmpdir=$HOME

# set to headless, just in case
-Djava.awt.headless=true

# ensure UTF-8 encoding by default (e.g. filenames)
-Dfile.encoding=UTF-8

# use our provided JNA always versus the system one
#-Djna.nosys=true

# Turn on JRuby invokedynamic
-Djruby.compile.invokedynamic=true
# Force Compilation
-Djruby.jit.threshold=0

## heap dumps

# generate a heap dump when an allocation from the Java heap fails
# heap dumps are created in the working directory of the JVM
-XX:+HeapDumpOnOutOfMemoryError

# specify an alternative path for heap dumps
# ensure the directory exists and has sufficient space
#-XX:HeapDumpPath=${LOGSTASH_HOME}/heapdump.hprof

## GC logging
#-XX:+PrintGCDetails
#-XX:+PrintGCTimeStamps
#-XX:+PrintGCDateStamps
#-XX:+PrintClassHistogram
#-XX:+PrintTenuringDistribution
#-XX:+PrintGCApplicationStoppedTime

# log GC status to a file with time stamps
# ensure the directory exists
#-Xloggc:${LS_GC_LOG_FILE}

# Entropy source for randomness
-Djava.security.egd=file:/dev/urandom
#kibana kibana.yaml
# Kibana is served by a back end server. This setting specifies the port to use.
server.port: 5601

# Specifies the address to which the Kibana server will bind. IP addresses and host names are both valid values.
# The default is 'localhost', which usually means remote machines will not be able to connect.
# To allow connections from remote users, set this parameter to a non-loopback address.
server.host: "192.168.1.0"

# Enables you to specify a path to mount Kibana at if you are running behind a proxy.
# Use the `server.rewriteBasePath` setting to tell Kibana if it should remove the basePath
# from requests it receives, and to prevent a deprecation warning at startup.
# This setting cannot end in a slash.
#server.basePath: ""

# Specifies whether Kibana should rewrite requests that are prefixed with
# `server.basePath` or require that they are rewritten by your reverse proxy.
# This setting was effectively always `false` before Kibana 6.3 and will
# default to `true` starting in Kibana 7.0.
#server.rewriteBasePath: false

# The maximum payload size in bytes for incoming server requests.
#server.maxPayloadBytes: 1048576

# The Kibana server's name.  This is used for display purposes.
#server.name: "your-hostname"

# The URL of the Elasticsearch instance to use for all your queries.
elasticsearch.url: "http://192.168.1.0:9200"

# When this setting's value is true Kibana uses the hostname specified in the server.host
# setting. When the value of this setting is false, Kibana uses the hostname of the host
# that connects to this Kibana instance.
#elasticsearch.preserveHost: true

# Kibana uses an index in Elasticsearch to store saved searches, visualizations and
# dashboards. Kibana creates a new index if the index doesn't already exist.
#kibana.index: ".kibana"

# The default application to load.
#kibana.defaultAppId: "home"

# If your Elasticsearch is protected with basic authentication, these settings provide
# the username and password that the Kibana server uses to perform maintenance on the Kibana
# index at startup. Your Kibana users still need to authenticate with Elasticsearch, which
# is proxied through the Kibana server.
#elasticsearch.username: "user"
#elasticsearch.password: "pass"

# Enables SSL and paths to the PEM-format SSL certificate and SSL key files, respectively.
# These settings enable SSL for outgoing requests from the Kibana server to the browser.
#server.ssl.enabled: false
#server.ssl.certificate: /path/to/your/server.crt
#server.ssl.key: /path/to/your/server.key

# Optional settings that provide the paths to the PEM-format SSL certificate and key files.
# These files validate that your Elasticsearch backend uses the same key files.
#elasticsearch.ssl.certificate: /path/to/your/client.crt
#elasticsearch.ssl.key: /path/to/your/client.key

# Optional setting that enables you to specify a path to the PEM file for the certificate
# authority for your Elasticsearch instance.
#elasticsearch.ssl.certificateAuthorities: [ "/path/to/your/CA.pem" ]

# To disregard the validity of SSL certificates, change this setting's value to 'none'.
#elasticsearch.ssl.verificationMode: full

# Time in milliseconds to wait for Elasticsearch to respond to pings. Defaults to the value of
# the elasticsearch.requestTimeout setting.
#elasticsearch.pingTimeout: 1500

# Time in milliseconds to wait for responses from the back end or Elasticsearch. This value
# must be a positive integer.
#elasticsearch.requestTimeout: 30000

# List of Kibana client-side headers to send to Elasticsearch. To send *no* client-side
# headers, set this value to [] (an empty list).
#elasticsearch.requestHeadersWhitelist: [ authorization ]

# Header names and values that are sent to Elasticsearch. Any custom headers cannot be overwritten
# by client-side headers, regardless of the elasticsearch.requestHeadersWhitelist configuration.
#elasticsearch.customHeaders: {}

# Time in milliseconds for Elasticsearch to wait for responses from shards. Set to 0 to disable.
#elasticsearch.shardTimeout: 30000

# Time in milliseconds to wait for Elasticsearch at Kibana startup before retrying.
#elasticsearch.startupTimeout: 5000

# Logs queries sent to Elasticsearch. Requires logging.verbose set to true.
#elasticsearch.logQueries: false

# Specifies the path where Kibana creates the process ID file.
#pid.file: /var/run/kibana.pid

# Enables you specify a file where Kibana stores log output.
logging.dest: /opt/kibana-6.4.1-linux-x86_64/logs/kibana.out

# Set the value of this setting to true to suppress all logging output.
#logging.silent: false

# Set the value of this setting to true to suppress all logging output other than error messages.
#logging.quiet: false

# Set the value of this setting to true to log all events, including system usage information
# and all requests.
#logging.verbose: false

# Set the interval in milliseconds to sample system and process performance
# metrics. Minimum is 100ms. Defaults to 5000.
#ops.interval: 5000

# The default locale. This locale can be used in certain circumstances to substitute any missing
# translations.
#i18n.defaultLocale: "en"
**# elastalert config.yaml / my_rule.yaml /smtp_auth_file.yaml 这个重点**
#config.yaml

# This is the folder that contains the rule yaml files
# Any .yaml file will be loaded as a rule
rules_folder: /usr/local/elastalert/example_rules

# How often ElastAlert will query Elasticsearch
# The unit can be anything from weeks to seconds
run_every:
  seconds: 30

# ElastAlert will buffer results from the most recent
# period of time, in case some log sources are not in real time
buffer_time:
  minutes: 15

# The Elasticsearch hostname for metadata writeback
# Note that every rule can have its own Elasticsearch host
es_host: 192.168.1.0

# The Elasticsearch port
es_port: 9200

# The AWS region to use. Set this when using AWS-managed elasticsearch
#aws_region: us-east-1

# The AWS profile to use. Use this if you are using an aws-cli profile.
# See http://docs.aws.amazon.com/cli/latest/userguide/cli-chap-getting-started.html
# for details
#profile: test

# Optional URL prefix for Elasticsearch
#es_url_prefix: elasticsearch

# Connect with TLS to Elasticsearch
#use_ssl: True

# Verify TLS certificates
#verify_certs: True

# GET request with body is the default option for Elasticsearch.
# If it fails for some reason, you can pass 'GET', 'POST' or 'source'.
# See http://elasticsearch-py.readthedocs.io/en/master/connection.html?highlight=send_get_body_as#transport
# for details
#es_send_get_body_as: GET

# Option basic-auth username and password for Elasticsearch
#es_username: someusername
#es_password: somepassword

# Use SSL authentication with client certificates client_cert must be
# a pem file containing both cert and key for client
#verify_certs: True
#ca_certs: /path/to/cacert.pem
#client_cert: /path/to/client_cert.pem
#client_key: /path/to/client_key.key

# The index on es_host which is used for metadata storage
# This can be a unmapped index, but it is recommended that you run
# elastalert-create-index to set a mapping
writeback_index: elastalert_status

# If an alert fails for some reason, ElastAlert will retry
# sending the alert until this time period has elapsed
alert_time_limit:
  days: 3
#my_rule.yaml
# Alert when the rate of events exceeds a threshold

# (Optional)
# Elasticsearch host
es_host: 192.168.1.0

# (Optional)
# Elasticsearch port
es_port: 9200

# (OptionaL) Connect with SSL to Elasticsearch
#use_ssl: True

# (Optional) basic-auth username and password for Elasticsearch
#es_username: someusername
#es_password: somepassword

# (Required)
# Rule name, must be unique
name: Logs Alert

# (Required)
# Type of alert.
# the frequency rule type alerts when num_events events occur with timeframe time
type: any


# (Required)
# Index to search, wildcard supported
index: message*

# (Required, frequency specific)
# Alert when this many documents matching the query occur within a timeframe
num_events: 3

# (Required, frequency specific)
# num_events must occur within this amount of time to trigger an alert
timeframe:
  minutes: 5

# (Required)
# A list of Elasticsearch filters used for find events
# These filters are joined with AND and nested in a filtered query
# For more info: http://www.elasticsearch.org/guide/en/elasticsearch/reference/current/query-dsl.html
filter:
- query:
    query_string:
      query: "message: 错误  OR error OR ERROR"


#- query:
#    query_string:
#      query: "NOT message: Read timed out executing"

#- term:
#    _type: "doc"
#- term:
#    beat.hostname: "design-0015"
#- term:
#    beat.hostname: "design-0008"


# (Required)
# The alert is use when a match is found
alert:
- "email"
alert_text: "ELK告警Mail:"
# (required, email specific)
# a list of email addresses to send alerts to
smtp_host: "smtp.126.com"
smtp_port: "465"
smtp_ssl: true
smtp_auth_file: /opt/elastalert/example_rules/smtp_auth_file.yaml
email_reply_to: "[email protected]"
from_addr: "[email protected]"
email:
- "[email protected]"
#smtp_auth_file.yaml
user: "[email protected]"
password: "123456"
	#设置elastalert启动脚本
	#!/bin/bash
	ps -ef|grep elastalert|grep -v grep|awk '{print $2}'|xargs kill -9

	nohup python -m elastalert.elastalert --rule /opt/elastalert/example_rules/my_rule.yaml --verbose --config /opt/elastalert/config.yaml &
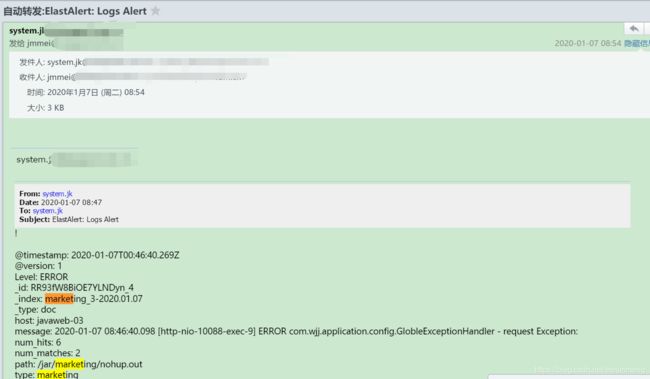
2.Elastalert安装及使用
1):安装
所需软件
Elasticsearch
Python 2.7
pip
python-pip python-dev libffi-dev libssl-dev
安装
pip install elastalert
或者克隆源码安装:
$ git clone https://github.com/Yelp/elastalert.git
2):介绍
Elastalert内置的告警方式:
	Email
    JIRA
    OpsGenie
    Commands
    HipChat
    MS Teams
    Slack
    Telegram
    AWS SNS
    VictorOps
    PagerDuty
    Exotel
    Twilio
    Gitter
3):使用
a.客户端配置logstash 采集数据到ES
#logstash.conf
input {
        file {
            path => "/jar/distribution/nohup.out"
            type => "distribution"
            start_position => "beginning"
            }
	file {
	    path => "/jar/goods/nohup.out"
	    type => "goods"
	    start_position => "beginning"
	    }
	file {
	    path => "/jar/marketing/nohup.out"
	    type => "marketing"
	    start_position => "beginning"
            }
	file {
 	    path => "/jar/physique/nohup.out"
	    type => "physique"
	    start_position => "beginning"
            }


    }

filter {
		#grok过滤,skywalking,level=debug,level=warn级别的日志。
       grok {
            match => [ "message", "%{SKYWALKING:skywalking}" ]
            match => [ "message", "%{WJJ_SPECIAL:wjj}" ]
            match => [ "message", "%{LOGLEVEL:Level}" ]
            }
        if [skywalking] == "192.168.1.191:11800" {
                drop {}
                }
        if [Level] == "DEBUG" {
                drop {}
                }
        if [Level] == "WARN" {
                drop {}
                }
}


    output {
	if [type] == "distribution" {

             elasticsearch {
                    hosts => ["192.168.1.155:9200"]
                    index => "distribution_1-%{+YYYY.MM.dd}"
                }
	    }
        if [type] == "goods" {
	     elasticsearch {
		hosts => ["192.168.1.155:9200"]
		index => "goods_1-%{+YYYY.MM.dd}"
		}
	}
	if [type] == "marketing" {
             elasticsearch {
     hosts => ["192.168.1.155:9200"]
                index => "marketing_1-%{+YYYY.MM.dd}"
                }
        }
	if [type] == "physique" {
             elasticsearch {
     hosts => ["192.168.1.155:9200"]
                index => "physique_1-%{+YYYY.MM.dd}"
                }
        }
    }
b.设置多个告警规则
#!/bin/bash
ps -ef|grep elastalert|grep -v grep|awk '{print $2}'|xargs kill -9

nohup python -m elastalert.elastalert --rule /usr/local/elastalert/example_rules/my_rule.yaml --verbose --config /usr/local/elastalert/config.yaml &

nohup python -m elastalert.elastalert --rule /usr/local/elastalert/example_rules/nlp_rule.yaml --verbose --config /usr/local/elastalert/config.yaml>nlp.out  &
[root@design-0015 elastalert]# cat start.sh
# cat /usr/local/elastalert/example_rules/my_rule.yaml

# Alert when the rate of events exceeds a threshold

# (Optional)
# Elasticsearch host
es_host: 192.168.1.155

# (Optional)
# Elasticsearch port
es_port: 9200

# (OptionaL) Connect with SSL to Elasticsearch
#use_ssl: True

# (Optional) basic-auth username and password for Elasticsearch
#es_username: someusername
#es_password: somepassword

# (Required)
# Rule name, must be unique
name: Logs Alert

# (Required)
# Type of alert.
# the frequency rule type alerts when num_events events occur with timeframe time
type: any


# (Required)
# Index to search, wildcard supported
index: device*,eureka*,gateway*,physique*,platform*,message*,orders*,payment*,account*,webmanager*,distribution*,goods*,marketing*,wechatseller*,wechat_webmanager*,ssr*,create*,webmanager-create*,chinawind-gf*,chinawind_webmanager*,dataprocess*,supply*

#tag*,recommend*,ifly-skill*,gen*

# (Required, frequency specific)
# Alert when this many documents matching the query occur within a timeframe
num_events: 5

# (Required, frequency specific)
# num_events must occur within this amount of time to trigger an alert
timeframe:
  minutes: 2

# (Required)
# A list of Elasticsearch filters used for find events
# These filters are joined with AND and nested in a filtered query
# For more info: http://www.elasticsearch.org/guide/en/elasticsearch/reference/current/query-dsl.html
filter:
- query:
    query_string:
      query: "message: (ERROR AND NOT 192.168.1.191 AND NOT 未查询到流水对应PromoteAwardInfo) OR (推送舌象结果To中医算法组response AND socketTimeout)"
#- query:
#    query_string:
#      query: "message: ERROR AND NOT message: 192.168.1.191 AND NOT message: 未查询到流水对应PromoteAwardInfo"

#- term:
#    _type: "doc"
#- term:
#    beat.hostname: "design-0015"
#- term:
#    beat.hostname: "design-0008"


# (Required)
# The alert is use when a match is found
alert:
- "email"
alert_text: "!"
# (required, email specific)
# a list of email addresses to send alerts to
smtp_host: "mail.126.com.cn"
smtp_port: "465"
smtp_ssl: true
smtp_auth_file: /usr/local/elastalert/example_rules/smtp_auth_file.yaml
email_reply_to: "[email protected]"
from_addr: "[email protected]"
email:
- "[email protected]"
c.kibana 设置查询索引


 后面默认点继续就可以…
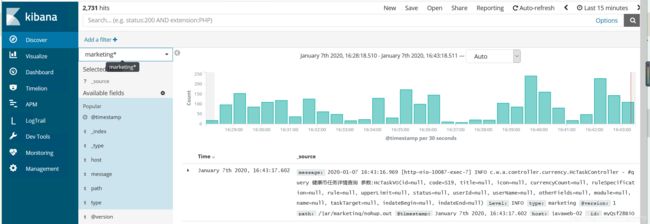
d.告警测试