pandas案例分析
问题如下:
一. 原代码是用python3写的,我用Python2.7遇到了问题,于是采用
https://blog.csdn.net/qq_33421080/article/details/77994061 的方法:
改写文件名为python2.exe,python3.exe,并
使用python2/3 -m pip install packages 来下载包
二. 讲清洗后的clean文件读入csv
import pandas as pddf_clean.to_csv('clean.csv',encoding='gb2312')
三. 一些函数
(1).groupby(['xx','xx','xx'])按变量分组
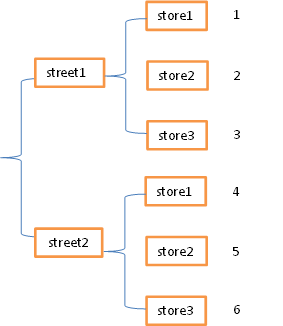
(2) stack 与unstack
|
|
store1 |
store2 |
store3 |
| street1 |
1 |
2 |
3 |
| street2 |
4 |
5 |
6 |
stack函数会将数据从”表格结构“变成”花括号结构“,即将其行索引变成列索引,反之,unstack函数将数据从”花括号结构“变成”表格结构“,即要将其中一层的列索引变成行索引。
(3).count() 计数,.mean()算均值, .sort_values(by ='xx',ascending=False)降序排序
Script:
import pandas as pd
import numpy as np
import os
path = r"D:\文档\2018年暑假\数据分析案例\excel"
os.chdir(path)
df =pd.read_csv('DataAnalyst.csv',encoding='gb2312')
df.info()
df.head(10)
len(df.positionId.unique())
df_duplicates = df.drop_duplicates(subset='positionId',keep='first')
df_duplicates.info()
def cut_word(word,method):
position = word.find('-')
length = len(word)
if position !=-1:
bottomSalary = word[:position-1]
topSalary = word[position+1:length-1]
else:
bottomSalary = word[:word.upper().find('K')]
topSalary = bottomSalary
if method == 'bottom':
return bottomSalary
else :
return topSalary
df_duplicates['topSalary'] = df_duplicates.salary.apply(cut_word,method = 'top')
df_duplicates['bottomSalary'] = df_duplicates.salary.apply(cut_word,method = 'bottom')
df_duplicates.topSalary = df_duplicates.topSalary.astype('int')
df_duplicates.bottomSalary = df_duplicates.bottomSalary.astype('int')
df_duplicates['avqSalary'] = df_duplicates.apply(lambda x:(x.bottomSalary+x.topSalary)/2,axis=1)
df_clean = df_duplicates[['city','companyShortName','companySize','education','positionName','positionLables','workYear','avqSalary']]
df_clean.head()
df_clean.city.value_counts()
df_clean.describe()
import matplotlib.pyplot as plt
plt.style.use('ggplot')
#df_clean.avqSalary.hist()
#df_clean.avqSalary.hist(bins=15)
#plt.show(df_clean.avqSalary.hist(bins=15))
#df_clean.boxplot(column = 'avqSalary',by='city',figsize=(9,7))
import matplotlib
from matplotlib.font_manager import FontProperties
font_zh = FontProperties(fname="C:\Windows\Fonts\simsun.ttc")
ax=df_clean.boxplot(column = 'avqSalary',by='city',figsize=(9,7))
for label in ax.get_xticklabels():
label.set_fontproperties(font_zh)
plt.show(ax)
ax =df_clean.boxplot(column = 'avqSalary',by='education',figsize=(9,7))
for label in ax.get_xticklabels():
label.set_fontproperties(font_zh)
df_clean.sort_values(wordYear)
ax= df_clean.boxplot(column='avqSalary',by='workYear',figsize=(9,7))
for label in ax.get_xticklabels():
label.set_fontproperties(font_zh)
plt.show(ax)
#多变量对薪资的影响
df_sh_bj = df_clean[df_clean['city'].isin(['上海','北京'])]
ax=df_sh_bj.boxplot(column = 'avqSalary',by=['education','city'],figsize=(9,7))
for label in ax.get_xticklabels():
label.set_fontproperties(font_zh)
plt.show(ax)
df_clean.groupby('city').count()
df_clean.groupby(['city','education']).mean().unstack()
df_clean.groupby(['city','education']).avqSalary.count().unstack()
#按不同公司
df_clean.groupby(['companyShortName']).avqSalary.agg(['count','mean']).sort_values(by='count',ascending=False)
def topN(df,n=5):
counts = df.value_counts()
return counts.sort_values(ascending = False)[:n]
df_clean.groupby('city').positionName.apply(topN)
ax = df_clean.groupby('city').mean().plot.bar()
for label in ax.get_xticklabels():
label.set_fontproperties(font_zh)
ax = df_clean.groupby(['city','education']).mean().unstack().plot.bar(figsize=(14,6))
for label in ax.get_xticklabels():
label.set_fontproperties(font_zh)
ax.legend(prop = font_zh)
错误:
from matplotlib.font_manager import FontProperties
font_zh = FontProperties(fname="C:\Windows\Fonts\simsun.ttc")
ax=df_clean.boxplot(column = 'avqSalary',by='city',figsize=(9,7))
for label in ax.get_xticklabels():
label.set_fontproperties(font_zh)
windows字体存放目录与mac不同,在“C:\Windows\Fonts\simsun.ttc”