usage:

Produce output in the specified format.

   pprof  [options] [binary]  ...

Omit the format to get an interactive shell whose commands can be used
to generate various views of a profile

   pprof [options] [binary]  ...

Omit the format and provide the "-http" flag to get an interactive web
interface at the specified host:port that can be used to navigate through
various views of a profile.

   pprof -http [host]:[port] [options] [binary]  ...

Details:
  Output formats (select at most one):
    -callgrind       Outputs a graph in callgrind format
    -comments        Output all profile comments
    -disasm          Output assembly listings annotated with samples
    -dot             Outputs a graph in DOT format
    -eog             Visualize graph through eog
    -evince          Visualize graph through evince
    -gif             Outputs a graph image in GIF format
    -gv              Visualize graph through gv
    -kcachegrind     Visualize report in KCachegrind
    -list            Output annotated source for functions matching regexp
    -pdf             Outputs a graph in PDF format
    -peek            Output callers/callees of functions matching regexp
    -png             Outputs a graph image in PNG format
    -proto           Outputs the profile in compressed protobuf format
    -ps              Outputs a graph in PS format
    -raw             Outputs a text representation of the raw profile
    -svg             Outputs a graph in SVG format
    -tags            Outputs all tags in the profile
    -text            Outputs top entries in text form
    -top             Outputs top entries in text form
    -topproto        Outputs top entries in compressed protobuf format
    -traces          Outputs all profile samples in text form
    -tree            Outputs a text rendering of call graph
    -web             Visualize graph through web browser
    -weblist         Display annotated source in a web browser

  Options:
    -call_tree       Create a context-sensitive call tree
    -compact_labels  Show minimal headers
    -divide_by       Ratio to divide all samples before visualization
    -drop_negative   Ignore negative differences
    -edgefraction    Hide edges below *total
    -focus           Restricts to samples going through a node matching regexp
    -hide            Skips nodes matching regexp
    -ignore          Skips paths going through any nodes matching regexp
    -mean            Average sample value over first value (count)
    -nodecount       Max number of nodes to show
    -nodefraction    Hide nodes below *total
    -normalize       Scales profile based on the base profile.
    -output          Output filename for file-based outputs
    -positive_percentages Ignore negative samples when computing percentages
    -prune_from      Drops any functions below the matched frame.
    -relative_percentages Show percentages relative to focused subgraph
    -sample_index    Sample value to report (0-based index or name)
    -show            Only show nodes matching regexp
    -source_path     Search path for source files
    -tagfocus        Restricts to samples with tags in range or matched by regex
p
    -taghide         Skip tags matching this regexp
    -tagignore       Discard samples with tags in range or matched by regexp
    -tagshow         Only consider tags matching this regexp
    -trim            Honor nodefraction/edgefraction/nodecount defaults
    -unit            Measurement units to display

  Option groups (only set one per group):
    cumulative
      -cum             Sort entries based on cumulative weight
      -flat            Sort entries based on own weight
    granularity
      -addresses       Aggregate at the function level.
      -addressnoinlines Aggregate at the function level, including functions' ad
dresses in the output.
      -files           Aggregate at the file level.
      -functions       Aggregate at the function level.
      -lines           Aggregate at the source code line level.
      -noinlines       Aggregate at the function level.
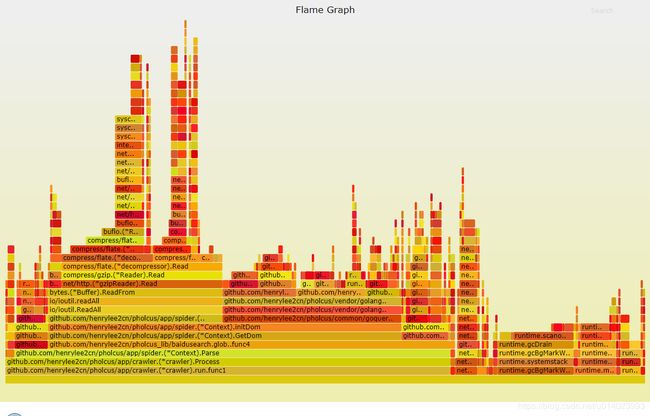
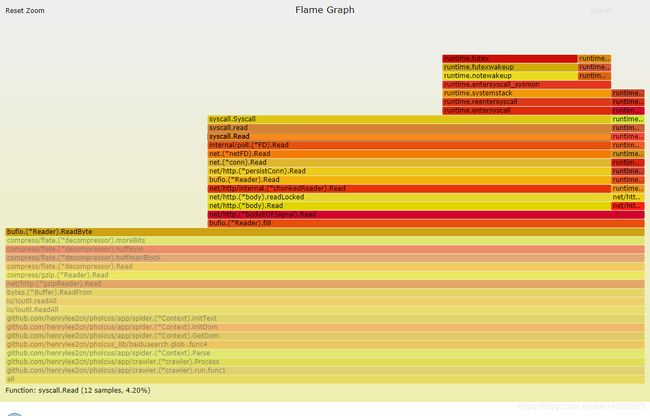
The web command writes a graph of the profile data in SVG format and opens it in a web browser. (There is also a gv command that writes PostScript and opens it in Ghostview. For either command, you need graphviz installed.)
var cpuProfile  = flag.String("cpuprofile", "", "write a cpu profile to the named file during execution")
func main(){
    startCPUProfile()
    defer stopCPUProfile()
}
var memProfile       = flag.String("memprofile", "", "write a memory profile to the named file after execution")
var memProfileRate   = flag.Int("memprofilerate", 0, "if > 0, sets runtime.MemProfileRate")
go run testDemo.go -p="runtime" -memprofile="./pprof/mem.pprof" -memprofilerate=10
3.2.3 程序阻塞概要文件
程序阻塞概要文件用于保存用户程序中的Goroutine阻塞事件的记录。
var blockProfile = flag.String("blockprofile", "", "write a goroutine blocking profile to the named file after execution")

var blockProfileRate = flag.Int("blockprofilerate", 1, "if > 0, calls runtime.SetBlockProfileRate()")
Showing nodes accounting for 2.50s, 9.66% of 25.87s total
Dropped 107 nodes (cum <= 0.13s)
Showing top 5 nodes out of 55
      flat  flat%   sum%        cum   cum%
         0     0%     0%     12.53s 48.43%  main.main
         0     0%     0%     12.53s 48.43%  runtime.main
         0     0%     0%     12.46s 48.16%  main.FindHavlakLoops
     2.42s  9.35%  9.35%     12.46s 48.16%  main.FindLoops
     0.08s  0.31%  9.66%      9.06s 35.02%  runtime.systemstack
每一行表示一个函数的信息。前两列表示函数在 CPU 上运行的时间以及百分比;第三列是当前所有函数累加使用 CPU 的比例;第四列和第五列代表这个函数以及子函数运行所占用的时间和比例(也被称为累加值 cumulative),应该大于等于前两列的值;最后一列就是函数的名字。如果应用程序有性能问题,上面这些信息应该能告诉我们时间都花费在哪些函数的执行上了。
androi中提到了布尔数组;
布尔数组默认的是false, 并且只会打印false或者是true
布尔数组的例子; 根据字符数组创建布尔数组
char[] c = {'p','u','b','l','i','c'};
//根据字符数组的长度创建布尔数组的个数
boolean[] b = new bool
文章摘自:http://blog.csdn.net/yangwawa19870921/article/details/7553181
在编写HQL时,可能会出现这种代码:
select a.name,b.age from TableA a left join TableB b on a.id=b.id
如果这是HQL,那么这段代码就是错误的,因为HQL不支持
1. 简单的for循环
public static void main(String[] args) {
for (int i = 1, y = i + 10; i < 5 && y < 12; i++, y = i * 2) {
System.err.println("i=" + i + " y="
异常信息本地化
Spring Security支持将展现给终端用户看的异常信息本地化,这些信息包括认证失败、访问被拒绝等。而对于展现给开发者看的异常信息和日志信息(如配置错误)则是不能够进行本地化的,它们是以英文硬编码在Spring Security的代码中的。在Spring-Security-core-x
近来工作中遇到这样的两个需求
1. 给个Date对象,找出该时间所在月的第一天和最后一天
2. 给个Date对象,找出该时间所在周的第一天和最后一天
需求1中的找月第一天很简单,我记得api中有setDate方法可以使用
使用setDate方法前,先看看getDate
var date = new Date();
console.log(date);
// Sat J
MyBatis的update元素的用法与insert元素基本相同,因此本篇不打算重复了。本篇仅记录批量update操作的
sql语句,懂得SQL语句,那么MyBatis部分的操作就简单了。 注意:下列批量更新语句都是作为一个事务整体执行,要不全部成功,要不全部回滚。
MSSQL的SQL语句
WITH R AS(
SELECT 'John' as name, 18 as