OpenCV 2D Histogram
2D Histogram
One dimensional histogram only needs to consider gray value, but 2D histogram needs to consider hue and saturation.
2D histogram in OpenCV
The parameters of cv2.calcHist() method are different between one-dimensional histogram and 2D histogram,parameters should be modified as follows:
- channels = [0, 1] :We need to deal with both H and S channels at the same time
- bins = [180, 256]: 180 for H channel and 256 for S channel
- range = [0, 180, 0, 256]: The value range of H is 0 to 180, and the value range of S is 0 to 256
import cv2
import numpy as np
img = cv2.imread('picture.jpeg')
hsv = cv2.cvtColor(img,cv2.COLOR_BGR2HSV)  # Convert picture to BGR
hist = cv2.calcHist([hsv], [0, 1], None, [180, 256], [0, 180, 0, 256]) # draw 2d histogram
2D histogram in Numpy
Numpy also provides a function to draw a 2D histogram: np.histogram2d()
import cv2
import numpy as np
from matplotlib import pyplot as plt
img = cv2.imread('picture.jpeg')
hsv = cv2.cvtColor(img,cv2.COLOR_BGR2HSV)
h, s = np.indices(hsv.shape[:2])  # return a new array built from an array index
hist, xbins, ybins = np.histogram2d(h.ravel(),s.ravel(),[180,256],[[0,180],[0,256]])
OpenCV Draw 2D histogram
Use the function matplotlib.pyplot.imshow() to draw a 2D histogram, and then match it with a different color map. In this way, we will have a more intuitive understanding of the numerical value represented by each point.
Note: when using this function, remember to set the interpolation parameter to nearest.
import cv2
import numpy as np
from matplotlib import pyplot as plt
img = cv2.imread('picture.jpeg')
hsv = cv2.cvtColor(img,cv2.COLOR_BGR2HSV)
hist = cv2.calcHist( [hsv], [0, 1], None, [180, 256], [0, 180, 0, 256] )
plt.imshow(hist,interpolation = 'nearest')
plt.show()
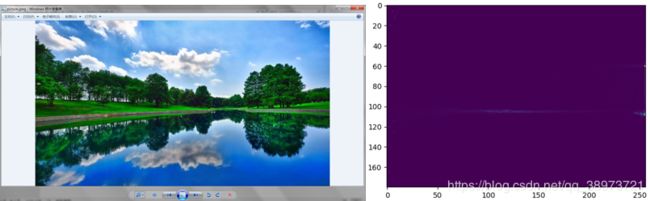
x-axis shows s value, y-axis shows H value