Matplotlib 使用笔记(三)——多图合并
1、Subplot 多合一显示
plt.figure()
plt.subplot(2,2,1)                 #设置图像窗口为2行2列,当前位置为1
plt.plot([0,1],[0,1])              #设置坐标范围
plt.subplot(2,2,2)
plt.plot([0,1],[0,2])
plt.subplot(223)                   #另一种表示,逗号可去掉
plt.plot([0,1],[0,3])
plt.subplot(224)
plt.plot([0,1],[0,4])
2、Subplot 分格显示
1、.subplot2grid:
###method 1  subplot2grid
############################
plt.figure()
ax1 = plt.subplot2grid((3, 3),                         # 将整个图像窗口分成3行3列
                       (0, 0),                         # 从第0行第0列开始作图,即索引从0开始
                       colspan=3)                      # 列的跨度为3
ax1.plot([0, 1], [0, 1])                               # 画小图
ax1.set_title('ax1_title')                             # 设置小图的标题
ax2 = plt.subplot2grid((3, 3), (1, 0), colspan=2)
ax3 = plt.subplot2grid((3, 3), (1, 2), rowspan=2)
ax4 = plt.subplot2grid((3, 3), (2, 0))
ax5 = plt.subplot2grid((3, 3), (2, 1))
colspan 和rowspan分别表示列和行的跨度,缺省时默认为1.
注意:命名标题和坐标轴时,使用.set_title, .set_xlabel, .set_ylabel.

2、gridspec:
首先要导入gridspec
import matplotlib.pyplot as plt
import matplotlib.gridspec as gridspec

###method 2 gridspec
############################
plt.figure()
gs = gridspec.GridSpec(3, 3)             # 将整个图像窗口分成3行3列
ax6 = plt.subplot(gs[0, :])              # 索引从0开始,描述位置
ax7 = plt.subplot(gs[1, :2])
ax8 = plt.subplot(gs[1:, 2])
ax9 = plt.subplot(gs[-1, 0])
ax10 = plt.subplot(gs[-1, -2])

plt.show()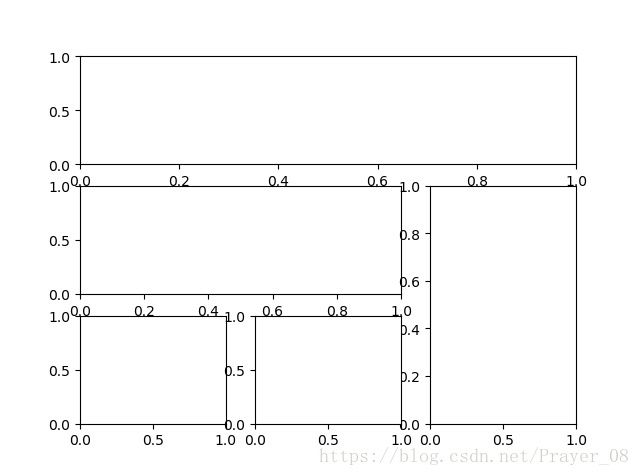
3、.subplots
###method 3  subplots
############################
f, ((ax11, ax12),(ax13, ax14)) = plt.subplots(2,2,                 # 建立一个2行2列的图像窗口
                                              sharex = True,       # 共享x坐标轴
                                              sharey = True)       # 共享y坐标轴
ax11.scatter([1,2],[1,2])                                          # 在ax11上绘制散点
plt.tight_layout()                                                 # 紧凑显示图像
((ax11, ax12),(ax13, ax14))表示从第一行从左至右依次存放ax11
和ax12,第二行从左至右依次存放ax13和ax14

3、图中图
fig = plt.figure()

# 创建数据
x = [1, 2, 3, 4, 5, 6, 7]
y = [1, 3, 4, 2, 5, 8, 6]

left, bottom, width, height = 0.1, 0.1, 0.8, 0.8          # 确定大图的位置,4个值为占整个figure坐标系的百分百
ax1 = fig.add_axes([left, bottom, width, height])
ax1.plot(x, y, 'r')
ax1.set_xlabel('x')
ax1.set_ylabel('y')
ax1.set_title('title')

left, bottom, width, height = 0.2, 0.6, 0.25, 0.25        # 确定小图1的位置
ax2 = fig.add_axes([left, bottom, width, height])
ax2.plot(y, x, 'b')
ax2.set_xlabel('x')
ax2.set_ylabel('y')
ax2.set_title('title inside 1')

###another method#####
plt.axes([0.6, 0.2, 0.25, 0.25])                          # 确定小图2的位置
plt.plot(y[::-1], x, 'g')                                 # 注意对y进行了逆序处理
plt.xlabel('x')
plt.ylabel('y')
plt.title('title inside 2')
4、次坐标轴
import matplotlib.pyplot as plt
import numpy as np

x = np.arange(0, 10, 0.1)
y1 = 0.05 * x**2
y2 = -1 * y1

fig, ax1 = plt.subplots()                # 获取figure默认的坐标系ax1

ax2 = ax1.twinx()                        # 镜面获取ax2
ax1.plot(x, y1, 'g-')                    # green, solid line
ax1.set_xlabel('X data')
ax1.set_ylabel('Y1 data', color='g')
ax2.plot(x, y2, 'b--')                   # blue
ax2.set_ylabel('Y2 data', color='b')

plt.show()
5、Animation 动画
调用FuncAnimation函数生成动画
from matplotlib import animation
import matplotlib.pyplot as plt
import numpy as np

fig, ax = plt.subplots()

x = np.arange(0, 2*np.pi, 0.01)
line, = ax.plot(x, np.sin(x))

# 构造自定义动画函数
def animate(i):
    line.set_ydata(np.sin(x + i/10.0))
    return line,

# 构造初始帧函数
def init():
    line.set_ydata(np.sin(x))
    return line,

ani = animation.FuncAnimation(fig=fig,            # 进行动画绘制
                              func=animate,       # 自定义动画函数,即传入定义的韩式animate
                              frames=100,         # 动画长度,一次循环包含的帧数
                              init_func=init,     # 自定义初始帧
                              interval=20,        # 更新频率,以ms计
                              blit=True)          # 选择更新所有点,仅还是更新产生变化的点

plt.show()
2018.08.08 整理于莫烦Python教程
https://morvanzhou.github.io/tutorials/data-manipulation/plt/