python报表利器TableOne学习实践
报表是很多业务中都需要使用到的一项工具,java里面有很多优秀的报表软件,当前商业化的报表软件做的也是很优秀的,那么python中有没有可以免费使用的报表软件或者库呢,当然是有的,今天就简单学习一下报表利器tableone的相关使用,,别看简单,但是功能强大,tableone的源码都是可以读读的,毕竟不是很多。
以美国大选数据为例进行简单的统计分析生成报表具体实现如下:
def simpelDemo():
    '''
    分析了96年美国大选数据,用groupby参数指定了其因变量,categorical参数指定了自变量中的分类型变量,使用pval=True指定了需要计算假设检验结果,程序最后将结果保存到excel文件中
    '''
    data = sm.datasets.anes96.load_pandas().data
    categorical = ['TVnews', 'selfLR', 'ClinLR', 'educ', 'income']
    groupby = 'vote'
    mytable = TableOne(data, categorical=categorical,
                                groupby=groupby, pval=True)
    mytable.to_excel("american.xlsx")
结果输出的文件截图如下:
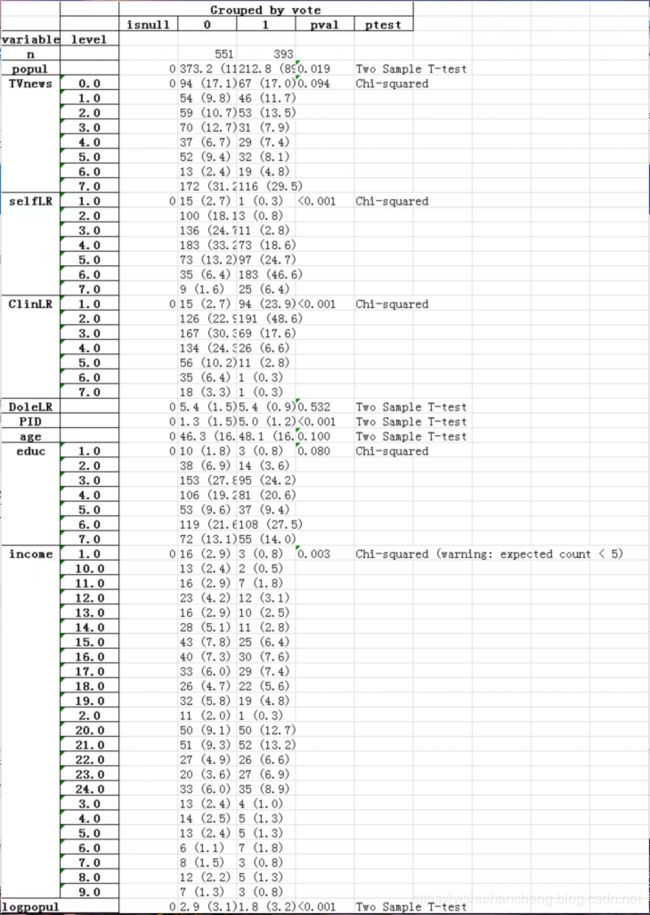
个人感觉还是很不错的了。
接下来拿官方提供的一个小例子做一个实践,具体如下:
def demo():
    '''
    文件操作
    '''
    try:
        url="https://raw.githubusercontent.com/tompollard/data/master/primary-biliary-cirrhosis/pbc.csv"
        data=pd.read_csv(url)
    except:
        data=pd.read_csv('pbc.csv')
    columns = ['age','bili','albumin','ast','platelet','protime',
               'ascites','hepato','spiders','edema','sex', 'trt']
    categorical = ['ascites','hepato','edema','sex','spiders','trt']
    groupby = 'trt'
    nonnormal = ['bili']
    mytable = TableOne(data, columns, categorical, groupby, nonnormal)
    print "===========mytable==============="
    print mytable
    mytable = TableOne(data, columns, categorical, groupby, nonnormal, pval=True)
    mytable.to_csv('mytable.csv')
结果输出如下:
===========mytable===============
               Grouped by trt
                       isnull            1.0            2.0
variable level
n                                        158            154
age                         0    51.4 (11.0)    48.6 (10.0)
bili                        0  1.4 [0.8,3.2]  1.3 [0.7,3.6]
albumin                     0      3.5 (0.4)      3.5 (0.4)
ast                       106   120.2 (54.5)   125.0 (58.9)
platelet                   11  258.8 (100.3)   265.2 (90.7)
protime                     2     10.7 (0.9)     10.8 (1.1)
ascites  0.0              106     144 (91.1)     144 (93.5)
         1.0                        14 (8.9)       10 (6.5)
hepato   0.0              106      85 (53.8)      67 (43.5)
         1.0                       73 (46.2)      87 (56.5)
spiders  0.0              106     113 (71.5)     109 (70.8)
         1.0                       45 (28.5)      45 (29.2)
edema    0.0                0     132 (83.5)     131 (85.1)
         0.5                       16 (10.1)       13 (8.4)
         1.0                        10 (6.3)       10 (6.5)
sex      f                  0     137 (86.7)     139 (90.3)
         m                         21 (13.3)       15 (9.7)
trt      1.0              106    158 (100.0)
         2.0                                    154 (100.0)
[1] Warning, Hartigan's Dip Test reports possible multimodal distributions for: bili, protime.
[2] Warning, Tukey test indicates far outliers in: bili.
[3] Warning, test for normality reports non-normal distributions for: albumin, ast, bili, protime.

[Finished in 2.9s]
文件内容截图如下:
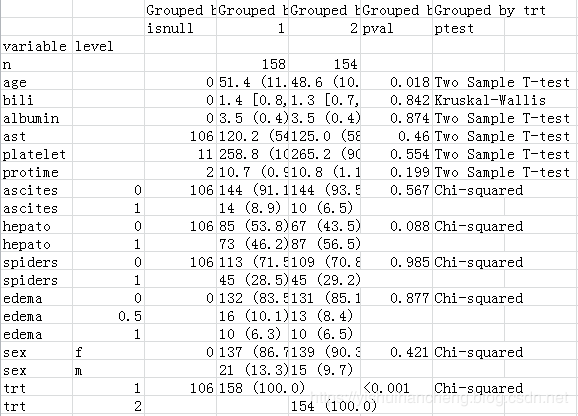
很强大的小工具,记录学习了。